We’re closing in on another great milestone of 30 issues. 30 months’ of juicy content and digital PR inspiration, that you hopefully find useful when it comes to thinking up campaign ideas for you and your clients.
Talking of milestones, we’ve also zoomed past the 1,500 subscribers mark and rapidly approaching 2,000, which is incredibly encouraging to see. If you aren’t already subscribed, please consider doing so. I only ever send a small email once a month letting you know the latest issue is released.
Before we dive into the content, I wanted to say thanks to the sponsor of this issue, Stacker.
If you want to reap the benefits of great content (like brand authority, links, etc.), you need to check out Stacker Studio. They create data journalism on your behalf and distribute it to their impressive newswire of 2,500+ publishers, including Newsweek, MSN, SFGate, Chicago Tribune, and more. The result is hundreds of high-value, SEO-friendly pickups of your story, meaning more authority and reach to new audiences.
Bonus: They’re offering Content, Curated readers 10% off their first engagement! Book a call with their team today, and let them know I sent you. 🙂
Must-see Content 👀
How Deep is the Ocean? 🌊
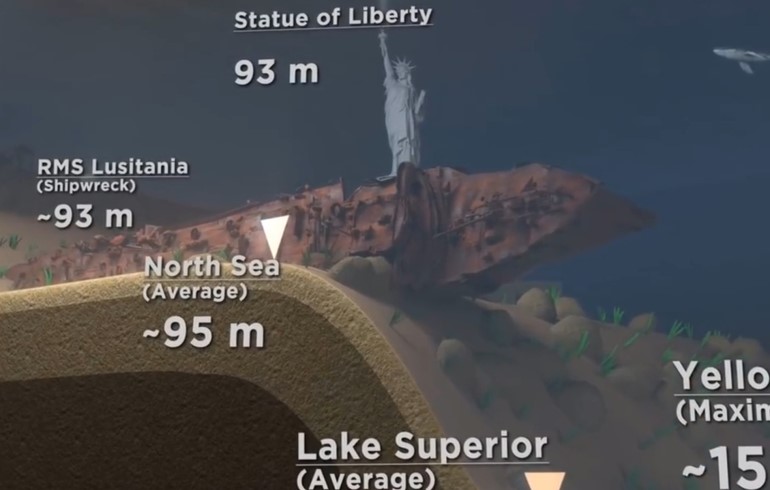
We’ll kick things off with this interesting visualisation I stumbled upon on Reddit. It’s actually from a YouTube channel called Meta Ball Studios, which is full of similar hard-hitting and eye-opening visualisations.
Postcards from 2050 🌆
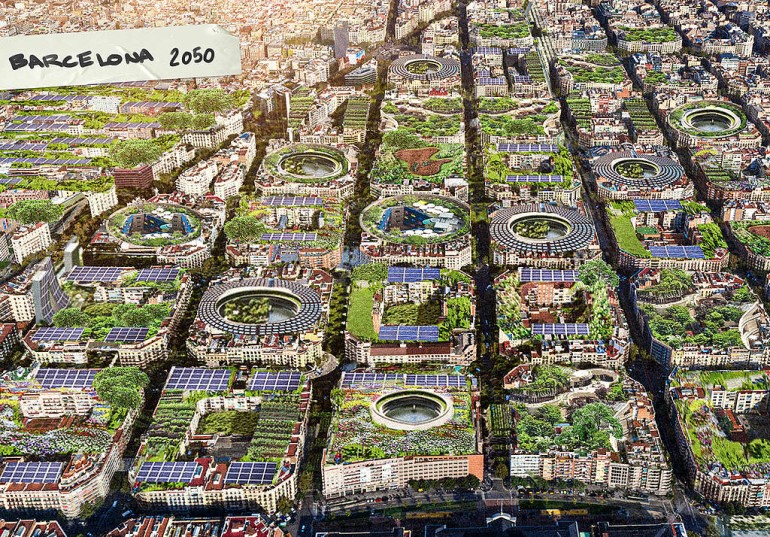
These types of ideas regularly crop up, and there’s been a few like this recently. Riding on the topicality of COP26, Greenpeace put together these postcards envisaging what future cities may look like if they adopt a greener and more sustainable approach.
Who Was The Ultimate 007? 🕵️♂️

In light of the recent release of the latest James Bond film, Luxe Watches crunched the data around who takes the crown as the best actor overall.
Discovered via Cameron Dhaliwal 🕵️♂️
Wes Anderson Collaborators 📽️
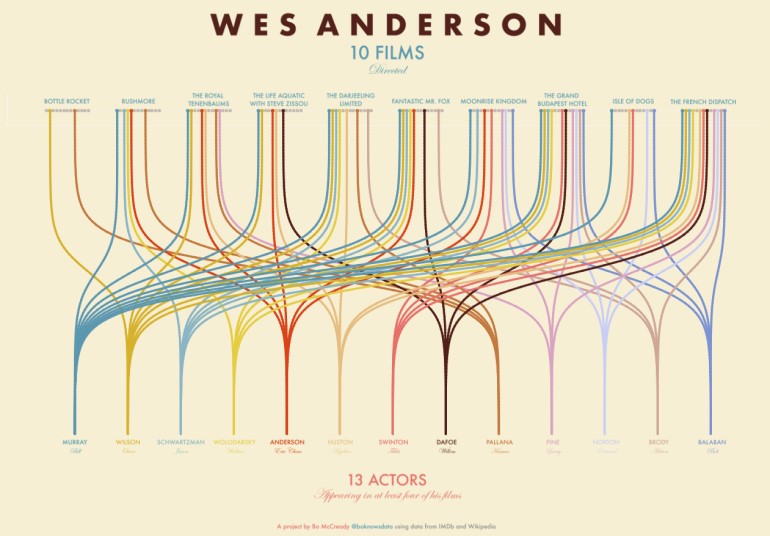
This data vis from Bo McCready is a great reminder how effective Tableau can be for this type of thing. While the initial learning curve can be a struggle, the outcome is worth it. Bo has a tonne of awesome visualisations so be sure to check out his profile.
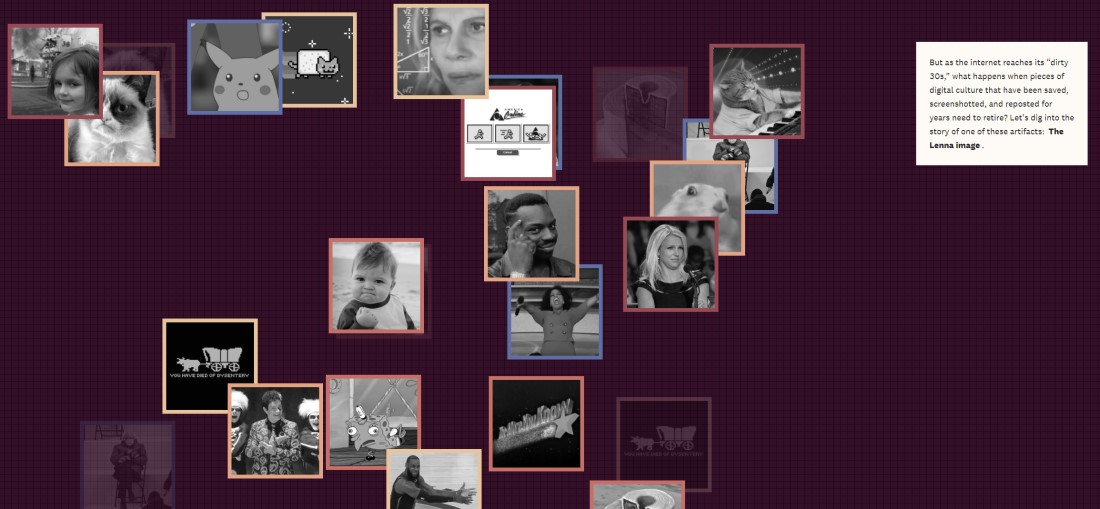
Can Data Die? ⚰️
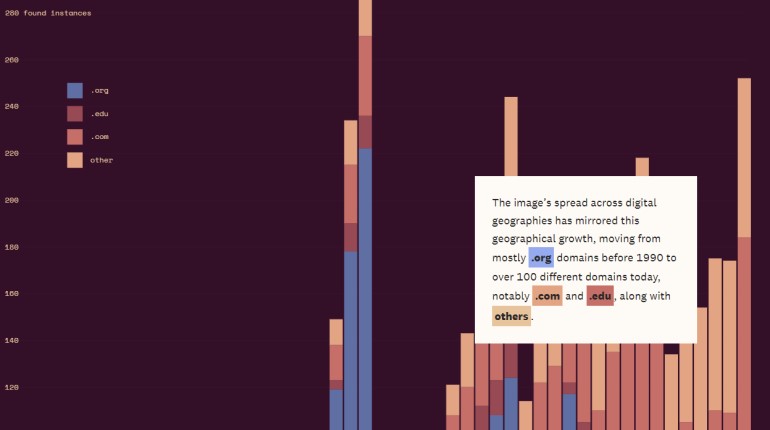
Another corker from the kings and queens of datavis, The Pudding. This piece dives into the story and data behind one of the internet’s oldest images, “Lenna”, and as you’d expect from The Pudding it’s beautifully presented.
9 Cities That Could Be Underwater by 2030 🏙️
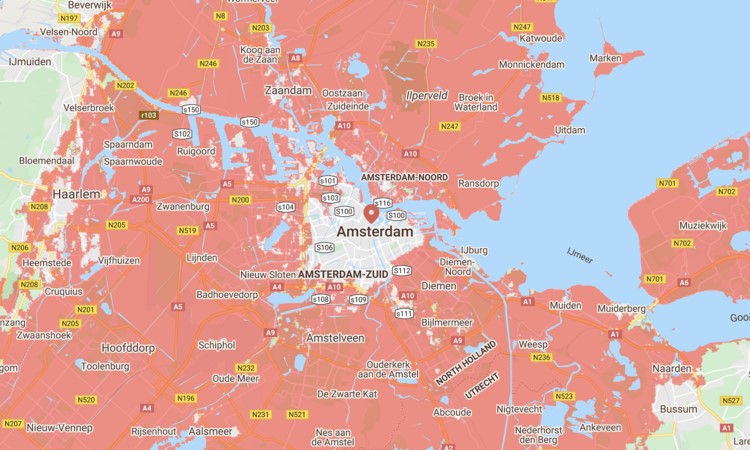
Along a similar vein to the aforementioned GreenPeace piece, Timeout used Climate Central to envisage cities that could potentially be underwater by 2030. It’s a sobering piece and good use of an existing tool.
The Most Successful Superheroes 🦸
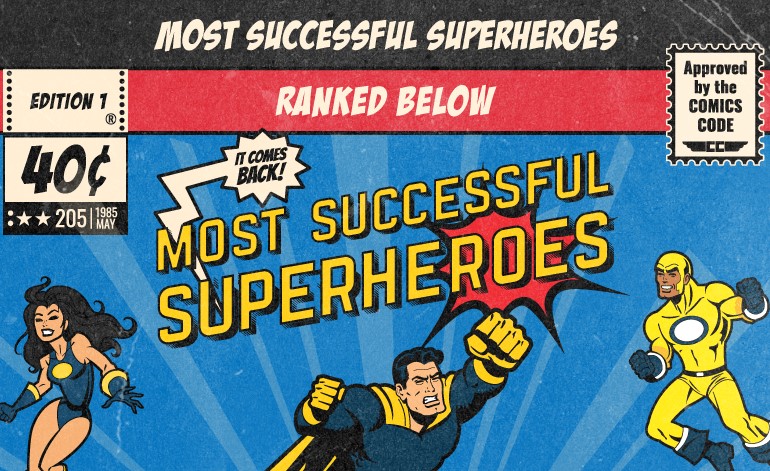
This is a really well presented piece on the most successful superheroes, crunching data around screen time, IMDB ratings, Reddit fans and more.
Discovered via Patrick Langridge 🕵️♂️
The Most Influential Women 🏆
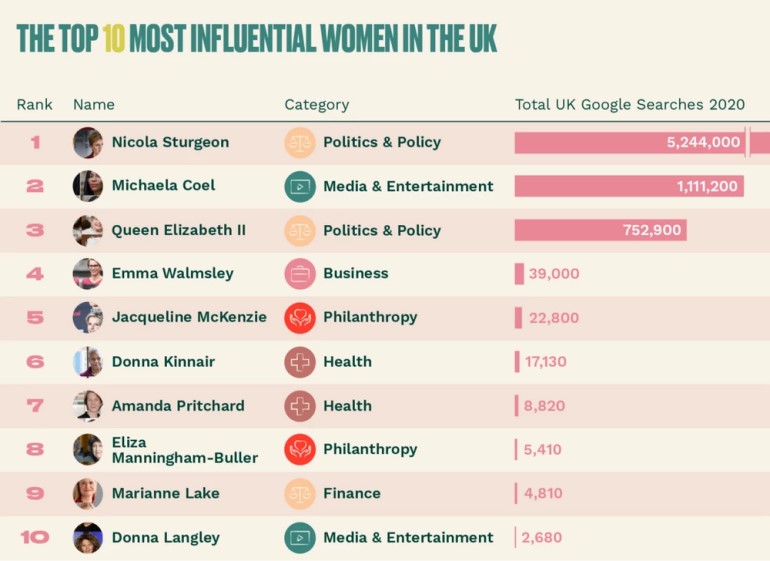
The Body Shop have put together an index type piece looking at the most influential women in the world. They included things like Google searches, social media followers, Wikipedia page views and more to create the ranking. While I think it’s pretty well presented, the headings are confusing, for example it says “The Top 100 Influential Women in the World”, and then directly underneath it says “The 100 Most Influential Women in the UK”.
The Most Popular Songs to Game 🎮
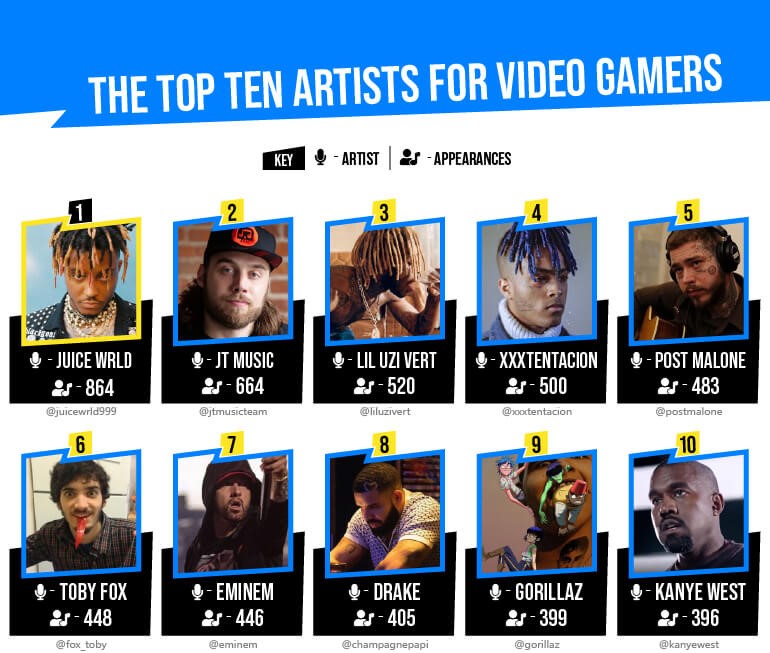
This piece looks at the most popular artists that appear in gaming themed playlists. It’s a format that’s been done many times over but is often well received. You can use tools like The Playlist Miner to make pieces like this yourself without much effort.
Discovered via Jack Prouse (Current Ballon D’oor champion) 🕵️♂️
What Sea Level Rise Will Look Like Around the Globe 🌊

Another sea level piece, which is becoming a bit of a theme in this issue. Climate Central took it a step further by visualising what sea level rise will actually look like around the world, with good use of image sliders and recognisable landmarks.
The Oldest Company in 58 UK Cities ⌛
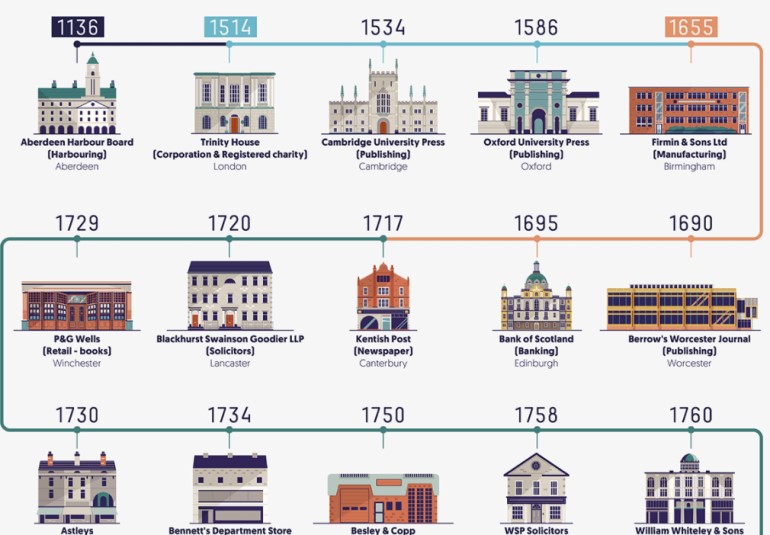
The design of this piece made me feel incredibly nostalgic, as we all used to churn out similar looking infographics on a daily basis. This one looks at the oldest company in 58 UK cities.
How the Longest Running Shows Rated Over Episodes 📺
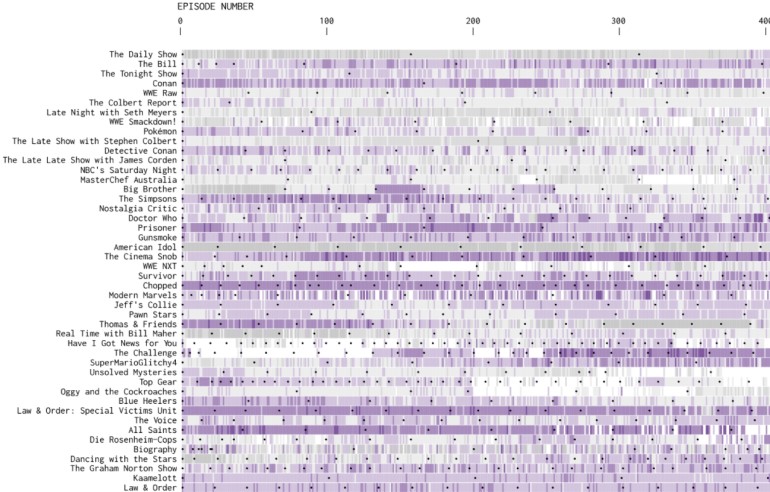
FlowingData did a great job at visualising the longest running TV shows and their episode ratings. While it looks confusing, it’s actually pretty effective at spotting consistent top performers and those who have experienced bad streaks.
More Great Content…
- Why Outswinging Corners Lead To More Chances but Inswingers Lead To More Goals ⚽ discovered via Patrick Langridge 🕵️♂️
- The Most Sex Positive Countries Around The World 🍆 discovered via Sian Thomas 🕵️♂️
- The Beloved McDonald’s Items That Are the Worst for the Environment discovered via Mairead Folan 🕵️♂️
- LEGO Halloween Fears 🎃
- The UK’s Spookiest Castles 👻
- This Climate Does Not Exist 🌊 discovered via Amy Walton 🕵️♂️
- The 20 Most Livable Towns and Cities in America 🌃 discovered via Vince Nero 🕵️♂️
- These Are the Most Haunted Tourist Attractions in the U.S. 💀 discovered via Patrick Langridge 🕵️♂️
- London’s Tube Map Recreated to Honour Black People Who Shaped Britain 🚆
- How Our Beaches Will Look if We Keep Littering 🏖️ discovered via Amy Walton 🕵️♂️
- London Landmarks Reimagined By School Kids 🧒
- Walt Disney World Ticket Price Increase vs Wages, Rent, and Gasoline 🐭
- Startup Cities: The Best Locations for Budding Entrepreneurs 💻
- Foodie Facts: Surprising Food Origins 🍲 discovered via Pete Bingham 🕵️♂️
- These Are the Most Popular “Cheesy” Romance Movies in Each State 💖
PR Stunts
The below campaigns may not have been intentional PR stunts, however they did attract substantial attention from the media.
Wayforward Machine ⌛

Archive.org recently released the ‘Wayforward Machine‘, which is a glimpse of how the internet may look in the future. It’s complete with invasive popups, political agendas and personal information prompts, and is an initiative that raises awareness around threats the open internet faces.
Heinz Christmas Dinner Soup 🎄
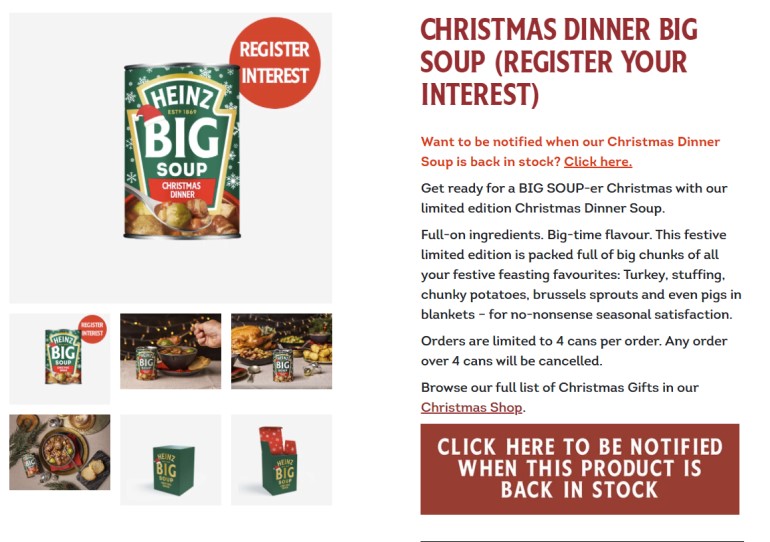
Ah, the iconic Christmas dinner in a can. This idea goes SO FAR back, originally spotted on Firebox’s website way back in 2012. Then, MHP Communications released the Christmas Tinner with GAME in 2014, which at the time went viral around the world. More recently, it was revived by GAME with the help of Rise at Seven, and now Heinz are getting involved.
This iteration looks the most appealing of them all (as in, to eat), though it was limited to 500 cans and they sold out pretty quickly.
Must-read Articles ☕
Below are some articles that are absolutely worthy of a read during your coffee break:
- How To Manage Your Inner Chimp In The PR Jungle 🐒 by Amy Walton
- Using Different Types of Visualisations to Represent Data 📊 by Sean Rainforth
- Designing Data Differently: Using Product as the Medium 📈 by Amy Jones
- 5 Tips for Managing Remote Digital PR Teams 💻 by JD Guariglia
Must-follow Marketer 👑

Who: Digital PR Tips
Why: Similar to last month we’re going for another Digital PR Twitter account, this time Digital PR Tips, who deliver daily tips straight to your Twitter timeline. I don’t actually know who is behind the account, but I want to thank them for not making another Digital PR newsletter (just a joke).
Drop them a follow here.
To Conclude
That rounds off issue #29, thanks as always to those who send over campaigns as it makes putting this newsletter together a piece of a cake. If you ever want to share a campaign please do get in touch: markprtr[@]gmail.com.
If you’re not yet subscribed, feel free to do so in order to be notified of future issues, and follow me on Twitter.
Thank you!
Mark.